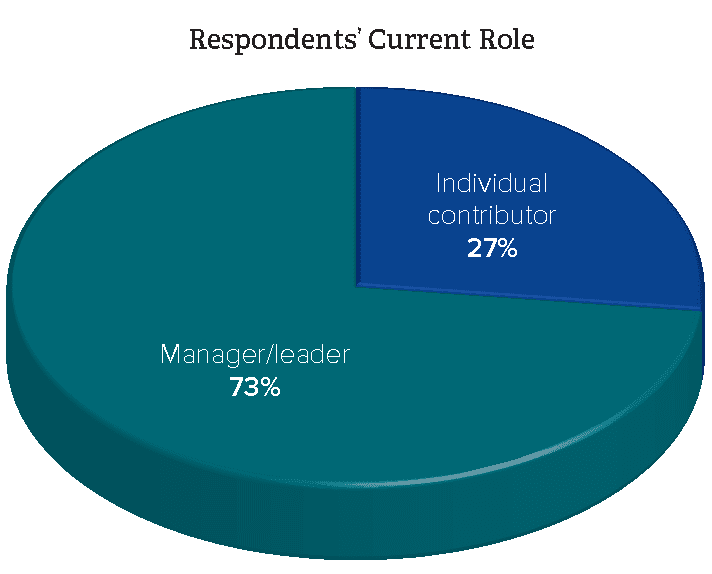
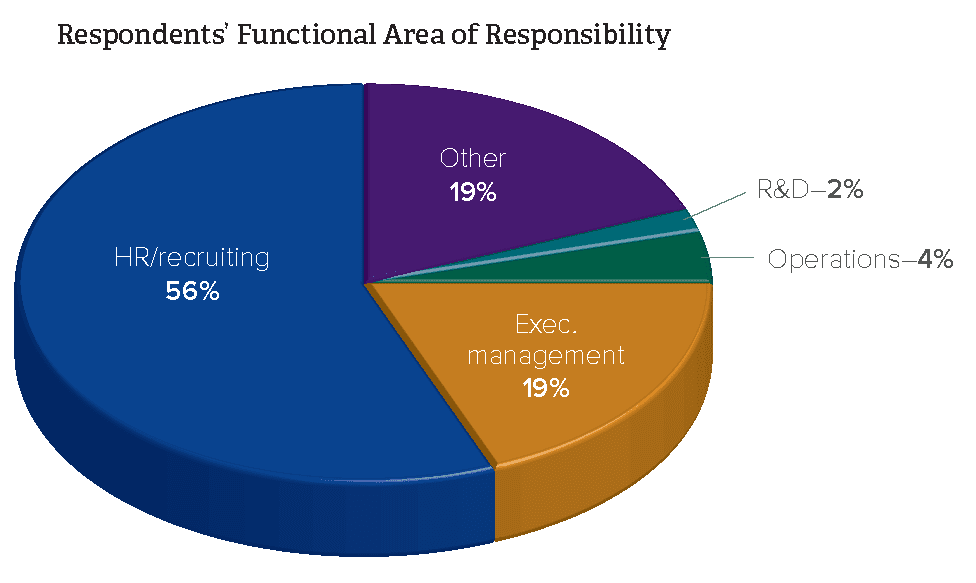
Appendix B: Respondent Demographics

| REGION | |
|---|---|
| North America | 86% |
| Central/South America | 1% |
| Africa | 2% |
| Middle East | 1% |
| Asia/Pacific | 5% |
| Europe | 6% |

| Number of Employees | |
|---|---|
| Less than 100 | 21% |
| 101-499 | 15% |
| 500-999 | 9% |
| 1,000-2,499 | 13% |
| 2,500-4,999 | 8% |
| 5,000-7,499 | 6% |
| 7,500-9,999 | 3% |
| 10,000-19,999 | 10% |
| More than 20,000 | 15% |
| Respondent’s Title/Level of Seniority | |
|---|---|
| Analyst | 4% |
| EVP/SVP | 5% |
| C-level | 8% |
| VP | 10% |
| Team Member | 11% |
| Director | 26% |
| Manager | 27% |
| Other | 9% |
| INDUSTRY | |
|---|---|
| Gov./Nonprofit | 14% |
| Bus./Prof. Services | 13% |
| Education | 12% |
| Healthcare | 11% |
| Financial Services/ Real Estate/Insurance | 11% |
| Auto/Ind./Man. | 5% |
| Chem./Energy/Utilities | 5% |
| IT Hardware/Software | 3% |
| Retail | 3% |
| Construction | 2% |
| Food & Bev./Cons. Goods | 2% |
| Bio/Pharma./Life Sci. | 2% |
| Telecomm | 2% |
| Aerospace/Defense | 2% |
| Other | 16% |
| Revenue | |
|---|---|
| <$10 million | 23% |
| $10-$50 million | 13% |
| $50-$100 million | 6% |
| $101-$500 million | 8% |
| $501-$999 million | 5% |
| $1-$4.9 billion | 12% |
| $5-$9.9 billion | 4% |
| $10-$14.9 billion | 3% |
| $15-$29.9 billion | 1% |
| $30-$40 billion | 2% |
| $40 billion | 6% |
| N/A—Gov./nonprofit | 17% |
Posted in Leadership and Emotional Intelligence
